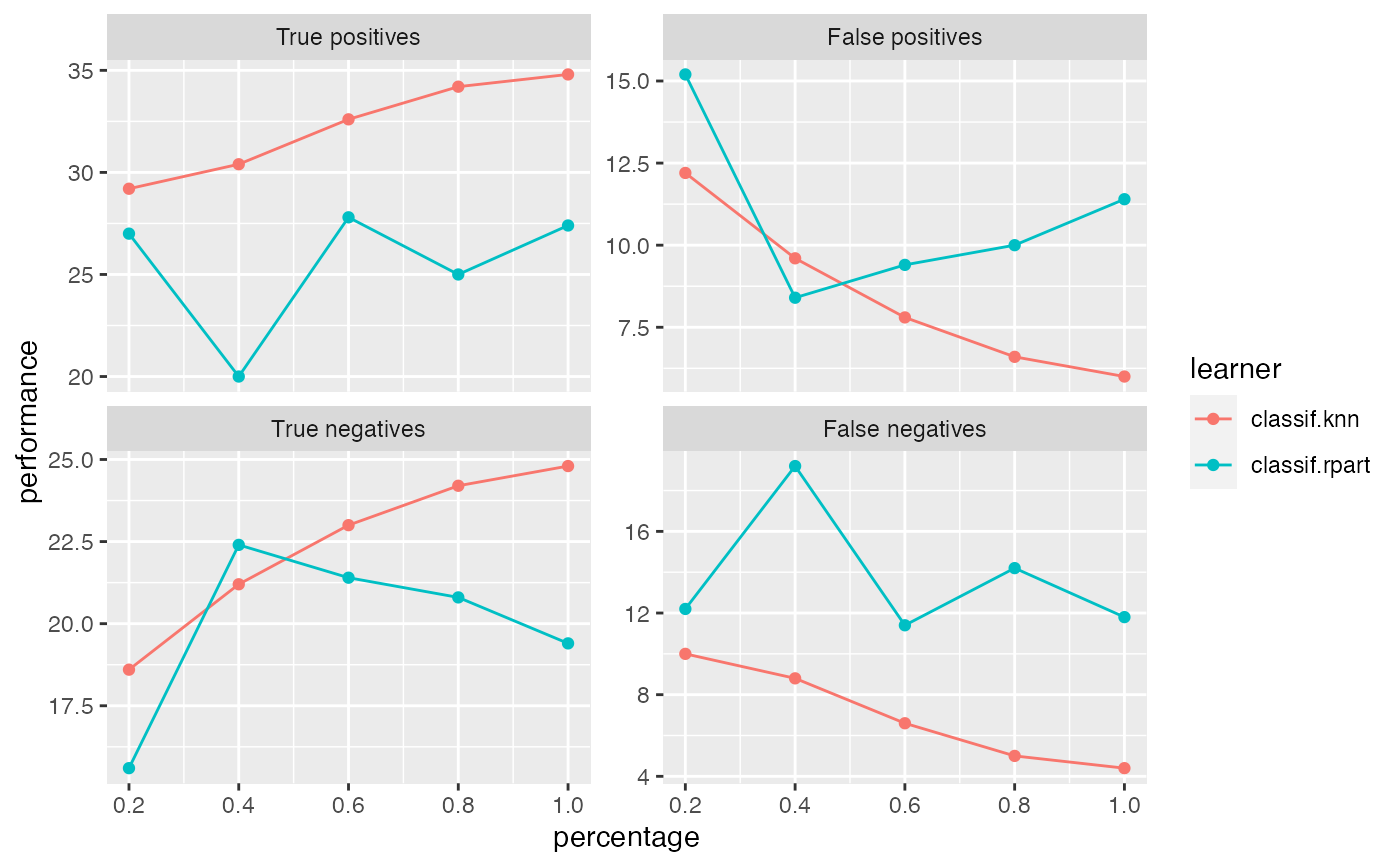
Observe how the performance changes with an increasing number of observations.
generateLearningCurveData(
  learners,
  task,
  resampling = NULL,
  percs = seq(0.1, 1, by = 0.1),
  measures,
  stratify = FALSE,
  show.info = getMlrOption("show.info")
)
Arguments
| learners | [(list of) Learner) |
|---|---|
| task | (Task) |
| resampling | (ResampleDesc | ResampleInstance) |
| percs | (numeric) |
| measures | [(list of) Measure) |
| stratify | ( |
| show.info | ( |
Value
(LearningCurveData). A list containing:
The Task
List of Measure)
Performance measuresdata (data.frame) with columns:
learnerNames of learners.percentagePercentages drawn from the training split.One column for each Measure passed to generateLearningCurveData.
See also
Other generate_plot_data:
generateCalibrationData(),
generateCritDifferencesData(),
generateFeatureImportanceData(),
generateFilterValuesData(),
generatePartialDependenceData(),
generateThreshVsPerfData(),
plotFilterValues()
Other learning_curve:
plotLearningCurve()
Examples
r = generateLearningCurveData(list("classif.rpart", "classif.knn"),
  task = sonar.task, percs = seq(0.2, 1, by = 0.2),
  measures = list(tp, fp, tn, fn),
  resampling = makeResampleDesc(method = "Subsample", iters = 5),
  show.info = FALSE)
plotLearningCurve(r)