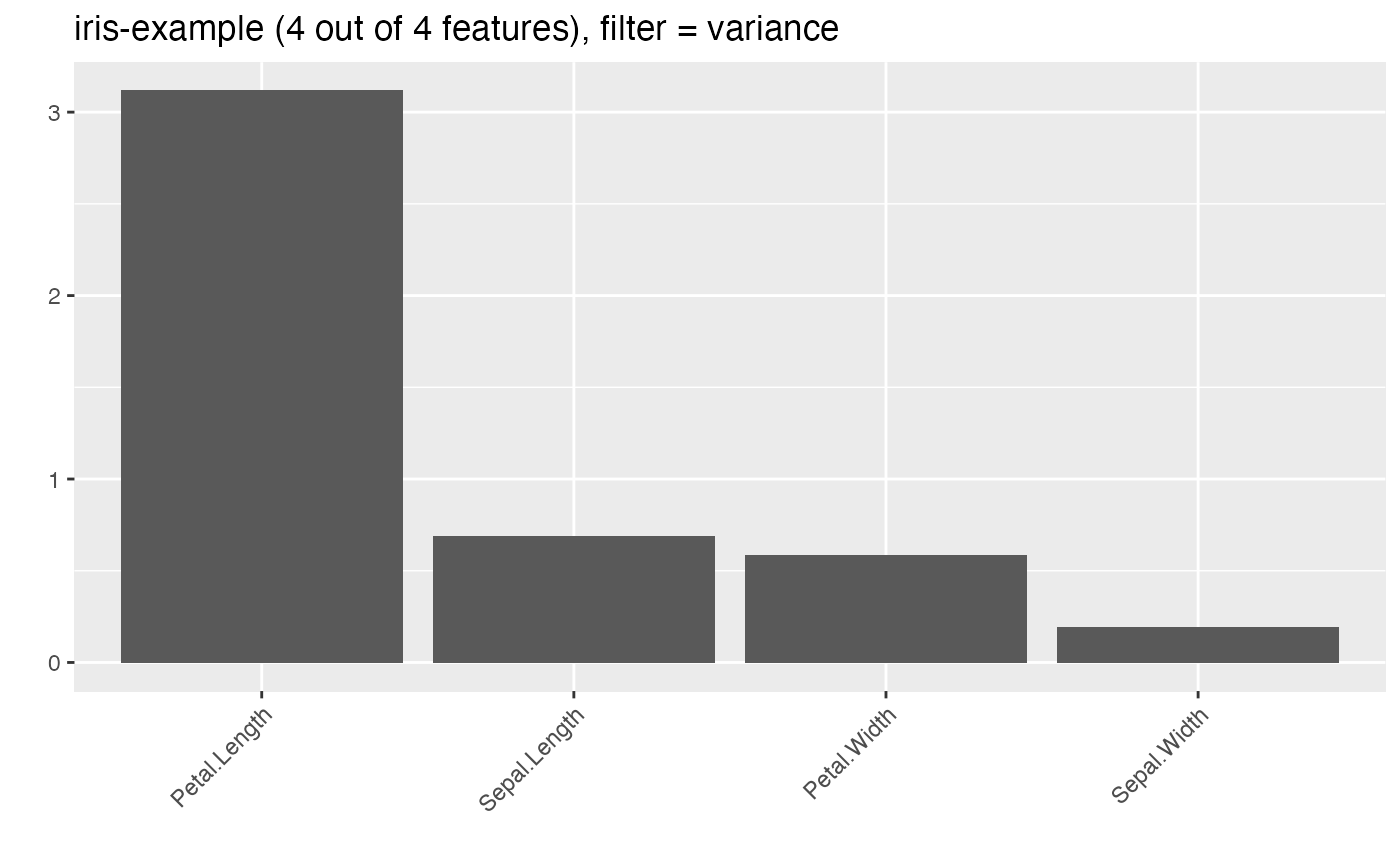
Plot filter values using ggplot2.
plotFilterValues(
  fvalues,
  sort = "dec",
  n.show = nrow(fvalues$data),
  filter = NULL,
  feat.type.cols = FALSE
)
Arguments
| fvalues | (FilterValues) |
|---|---|
| sort | (
Default is decreasing. |
| n.show | ( |
| filter | ( |
| feat.type.cols | ( |
Value
ggplot2 plot object.
See also
Other filter:
filterFeatures(),
generateFilterValuesData(),
getFilteredFeatures(),
listFilterEnsembleMethods(),
listFilterMethods(),
makeFilterEnsemble(),
makeFilterWrapper(),
makeFilter()
Other generate_plot_data:
generateCalibrationData(),
generateCritDifferencesData(),
generateFeatureImportanceData(),
generateFilterValuesData(),
generateLearningCurveData(),
generatePartialDependenceData(),
generateThreshVsPerfData()