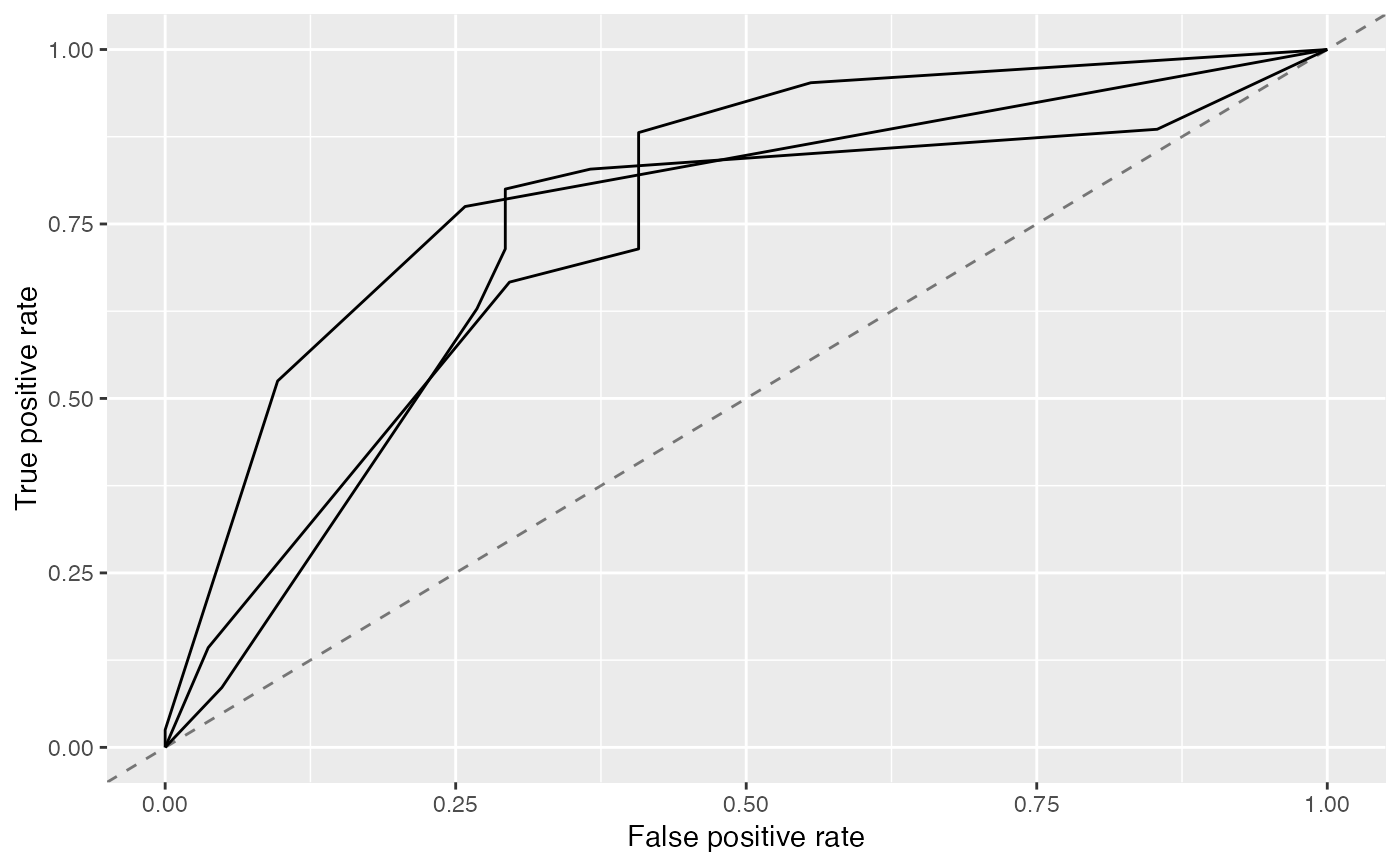
Plots a ROC curve from predictions.
plotROCCurves(
  obj,
  measures,
  diagonal = TRUE,
  pretty.names = TRUE,
  facet.learner = FALSE
)
Arguments
| obj | (ThreshVsPerfData) |
|---|---|
| measures | ([list(2)` of Measure) |
| diagonal | ( |
| pretty.names | ( |
| facet.learner | ( |
Value
ggplot2 plot object.
See also
Other plot:
createSpatialResamplingPlots(),
plotBMRBoxplots(),
plotBMRRanksAsBarChart(),
plotBMRSummary(),
plotCalibration(),
plotCritDifferences(),
plotLearningCurve(),
plotPartialDependence(),
plotResiduals(),
plotThreshVsPerf()
Other thresh_vs_perf:
generateThreshVsPerfData(),
plotThreshVsPerf()
Examples
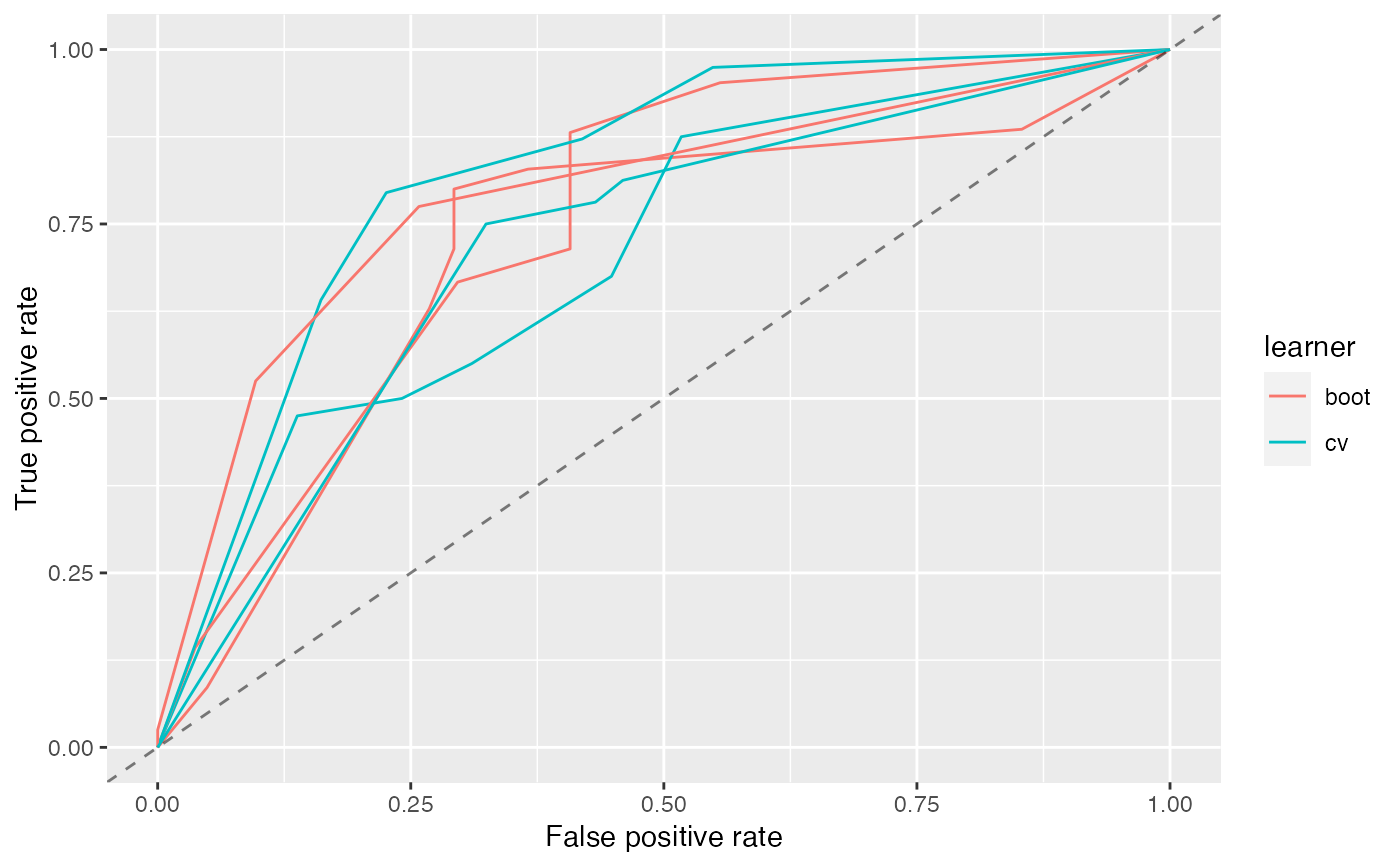
#> Error: Please use column names for `x`#> Error in predict(fit, task = sonar.task): object 'fit' not found#> Error in generateThreshVsPerfData(pred, list(fpr, tpr)): object 'pred' not foundplotROCCurves(roc)#> Error in checkClass(x, classes, ordered, null.ok): object 'roc' not found#>#>#>#>#>#>#>#>#>#>#>#>#>#>#>#>roc_l = generateThreshVsPerfData(list(boot = r, cv = r2), list(fpr, tpr), aggregate = FALSE) plotROCCurves(roc_l)# }