Plots a ROC curve from predictions.
Arguments
- obj
(ThreshVsPerfData)
Result of generateThreshVsPerfData.- measures
([list(2)` of Measure)
Default is the first 2 measures passed to generateThreshVsPerfData.- diagonal
(
logical(1))
Whether to plot a dashed diagonal line. Default isTRUE.- pretty.names
(
logical(1))
Whether to use the Measure name instead of the id in the plot. Default isTRUE.- facet.learner
(
logical(1))
Weather to use facetting or different colors to compare multiple learners. Default isFALSE.
See also
Other plot:
createSpatialResamplingPlots(),
plotBMRBoxplots(),
plotBMRRanksAsBarChart(),
plotBMRSummary(),
plotCalibration(),
plotCritDifferences(),
plotLearningCurve(),
plotPartialDependence(),
plotResiduals(),
plotThreshVsPerf()
Other thresh_vs_perf:
generateThreshVsPerfData(),
plotThreshVsPerf()
Examples
# \donttest{
lrn = makeLearner("classif.rpart", predict.type = "prob")
fit = train(lrn, sonar.task)
#> Error in x[0, , drop = FALSE]: incorrect number of dimensions
pred = predict(fit, task = sonar.task)
#> Error in predict(fit, task = sonar.task): object 'fit' not found
roc = generateThreshVsPerfData(pred, list(fpr, tpr))
#> Error in generateThreshVsPerfData(pred, list(fpr, tpr)): object 'pred' not found
plotROCCurves(roc)
#> Error in checkClass(x, classes, ordered, null.ok): object 'roc' not found
r = bootstrapB632plus(lrn, sonar.task, iters = 3)
#> Resampling: OOB bootstrapping
#> Measures: mmce.train mmce.test
#> [Resample] iter 1: 0.0817308 0.2820513
#> [Resample] iter 2: 0.0865385 0.2318841
#> [Resample] iter 3: 0.0673077 0.2638889
#>
#> Aggregated Result: mmce.b632plus=0.2148920
#>
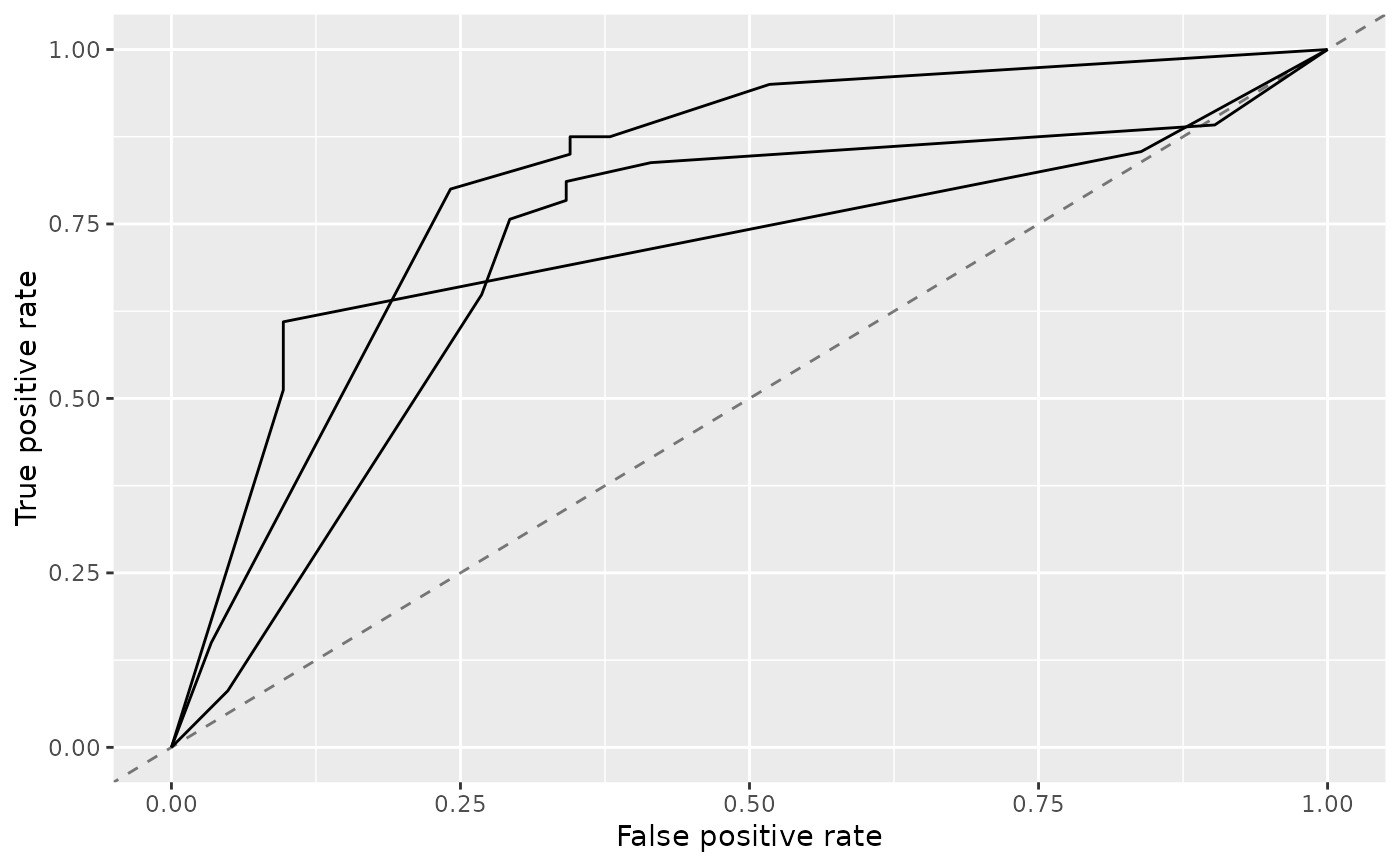
roc_r = generateThreshVsPerfData(r, list(fpr, tpr), aggregate = FALSE)
plotROCCurves(roc_r)
 r2 = crossval(lrn, sonar.task, iters = 3)
#> Resampling: cross-validation
#> Measures: mmce
#> [Resample] iter 1: 0.3913043
#> [Resample] iter 2: 0.2571429
#> [Resample] iter 3: 0.2898551
#>
#> Aggregated Result: mmce.test.mean=0.3127674
#>
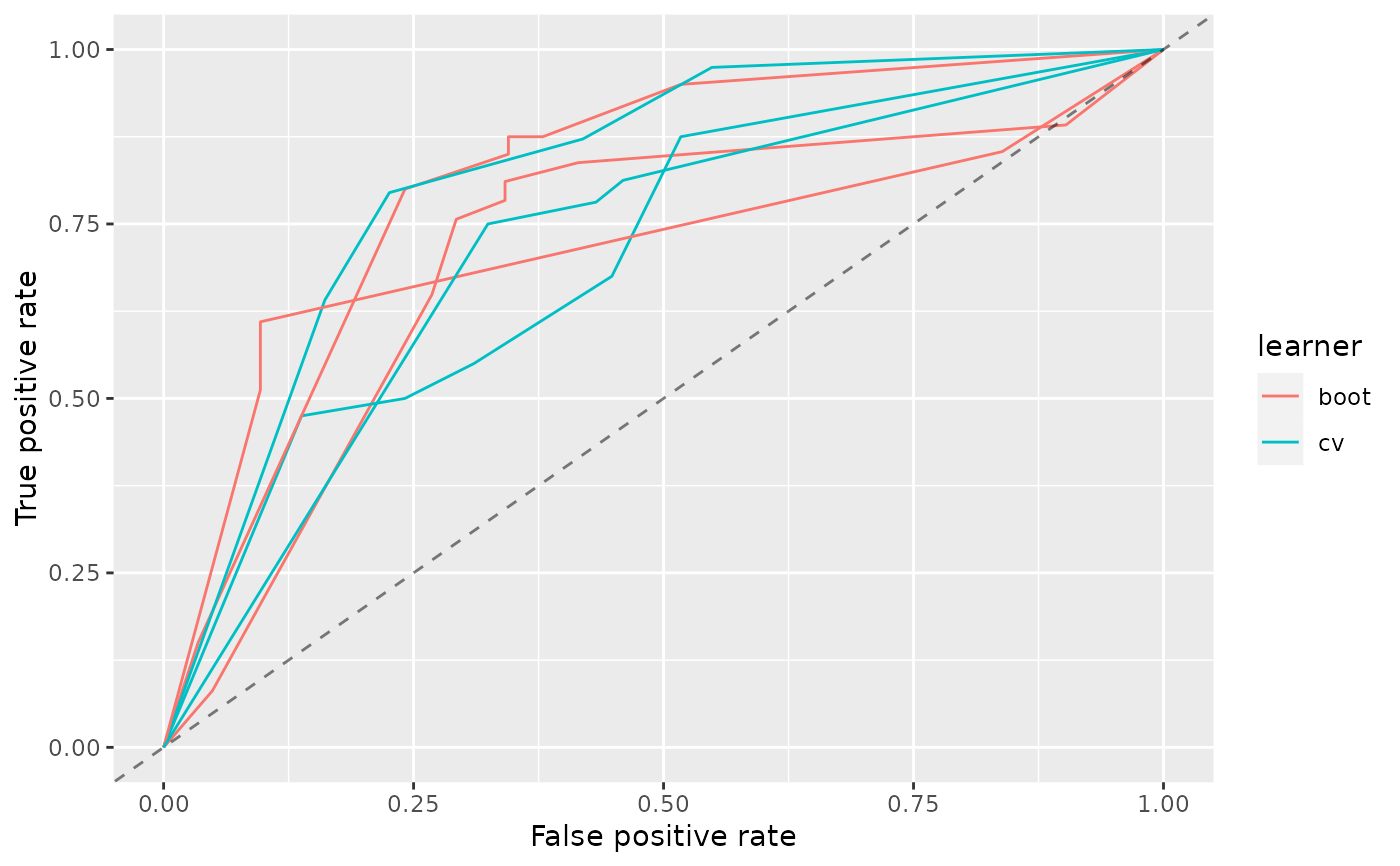
roc_l = generateThreshVsPerfData(list(boot = r, cv = r2), list(fpr, tpr), aggregate = FALSE)
plotROCCurves(roc_l)
r2 = crossval(lrn, sonar.task, iters = 3)
#> Resampling: cross-validation
#> Measures: mmce
#> [Resample] iter 1: 0.3913043
#> [Resample] iter 2: 0.2571429
#> [Resample] iter 3: 0.2898551
#>
#> Aggregated Result: mmce.test.mean=0.3127674
#>
roc_l = generateThreshVsPerfData(list(boot = r, cv = r2), list(fpr, tpr), aggregate = FALSE)
plotROCCurves(roc_l)
 # }
# }