Complete benchmark experiment to compare different learning algorithms across one or more tasks w.r.t. a given resampling strategy. Experiments are paired, meaning always the same training / test sets are used for the different learners. Furthermore, you can of course pass “enhanced” learners via wrappers, e.g., a learner can be automatically tuned using makeTuneWrapper.
Usage
benchmark(
  learners,
  tasks,
  resamplings,
  measures,
  keep.pred = TRUE,
  keep.extract = FALSE,
  models = FALSE,
  show.info = getMlrOption("show.info")
)
Arguments
- learners
(list of Learner | character)
Learning algorithms which should be compared, can also be a single learner. If you pass strings the learners will be created via makeLearner.- tasks
list of Task
Tasks that learners should be run on.- resamplings
(list of ResampleDesc | ResampleInstance)
Resampling strategy for each tasks. If only one is provided, it will be replicated to match the number of tasks. If missing, a 10-fold cross validation is used.- measures
(list of Measure)
Performance measures for all tasks. If missing, the default measure of the first task is used.- keep.pred
(
logical(1))
Keep the prediction data in thepredslot of the result object. If you do many experiments (on larger data sets) these objects might unnecessarily increase object size / mem usage, if you do not really need them. The default is set toTRUE.- keep.extract
(
logical(1))
Keep theextractslot of the result object. When creating a lot of benchmark results with extensive tuning, the resulting R objects can become very large in size. That is why the tuning results stored in theextractslot are removed by default (keep.extract = FALSE). Note that whenkeep.extract = FALSEyou will not be able to conduct analysis in the tuning results.- models
(
logical(1))
Should all fitted models be stored in the ResampleResult? Default isFALSE.- show.info
(
logical(1))
Print verbose output on console? Default is set via configureMlr.
See also
Other benchmark:
BenchmarkResult,
batchmark(),
convertBMRToRankMatrix(),
friedmanPostHocTestBMR(),
friedmanTestBMR(),
generateCritDifferencesData(),
getBMRAggrPerformances(),
getBMRFeatSelResults(),
getBMRFilteredFeatures(),
getBMRLearnerIds(),
getBMRLearnerShortNames(),
getBMRLearners(),
getBMRMeasureIds(),
getBMRMeasures(),
getBMRModels(),
getBMRPerformances(),
getBMRPredictions(),
getBMRTaskDescs(),
getBMRTaskIds(),
getBMRTuneResults(),
plotBMRBoxplots(),
plotBMRRanksAsBarChart(),
plotBMRSummary(),
plotCritDifferences(),
reduceBatchmarkResults()
Examples
lrns = list(makeLearner("classif.lda"), makeLearner("classif.rpart"))
tasks = list(iris.task, sonar.task)
rdesc = makeResampleDesc("CV", iters = 2L)
meas = list(acc, ber)
bmr = benchmark(lrns, tasks, rdesc, measures = meas)
#> Task: iris-example, Learner: classif.lda
#> Resampling: cross-validation
#> Measures: acc ber
#> [Resample] iter 1: 0.9866667 0.0151515
#> [Resample] iter 2: 0.9733333 0.0242504
#>
#> Aggregated Result: acc.test.mean=0.9800000,ber.test.mean=0.0197010
#>
#> Task: Sonar-example, Learner: classif.lda
#> Resampling: cross-validation
#> Measures: acc ber
#> [Resample] iter 1: 0.7403846 0.2629713
#> [Resample] iter 2: 0.6250000 0.3744444
#>
#> Aggregated Result: acc.test.mean=0.6826923,ber.test.mean=0.3187079
#>
#> Task: iris-example, Learner: classif.rpart
#> Resampling: cross-validation
#> Measures: acc ber
#> [Resample] iter 1: 0.9466667 0.0599473
#> [Resample] iter 2: 0.9333333 0.0608466
#>
#> Aggregated Result: acc.test.mean=0.9400000,ber.test.mean=0.0603969
#>
#> Task: Sonar-example, Learner: classif.rpart
#> Resampling: cross-validation
#> Measures: acc ber
#> [Resample] iter 1: 0.5769231 0.4288914
#> [Resample] iter 2: 0.7692308 0.2362963
#>
#> Aggregated Result: acc.test.mean=0.6730769,ber.test.mean=0.3325938
#>
rmat = convertBMRToRankMatrix(bmr)
print(rmat)
#> Sonar-example iris-example
#> classif.lda 1 1
#> classif.rpart 2 2
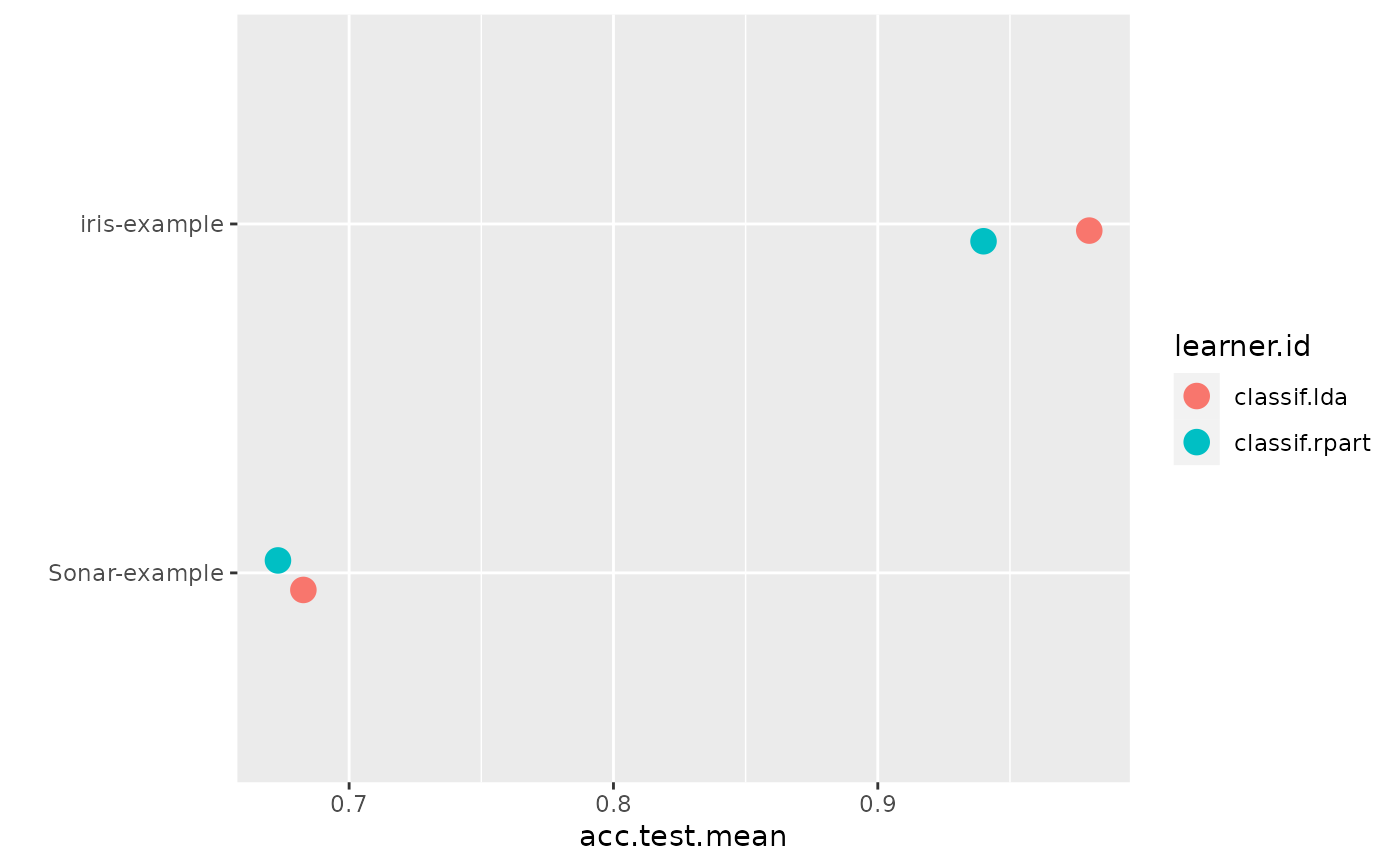
plotBMRSummary(bmr)
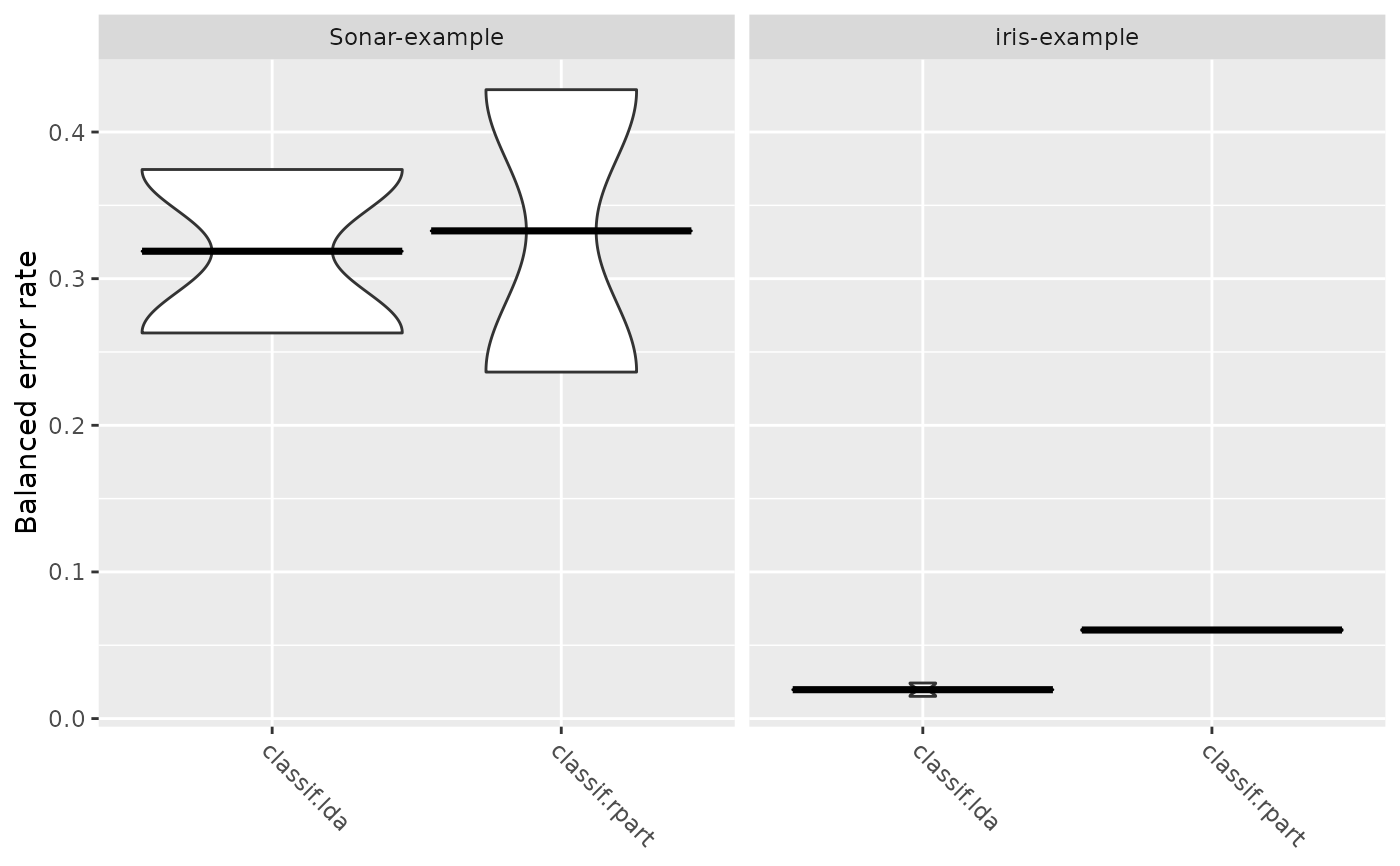
 plotBMRBoxplots(bmr, ber, style = "violin")
#> Warning: `fun.y` is deprecated. Use `fun` instead.
#> Warning: `fun.ymin` is deprecated. Use `fun.min` instead.
#> Warning: `fun.ymax` is deprecated. Use `fun.max` instead.
plotBMRBoxplots(bmr, ber, style = "violin")
#> Warning: `fun.y` is deprecated. Use `fun` instead.
#> Warning: `fun.ymin` is deprecated. Use `fun.min` instead.
#> Warning: `fun.ymax` is deprecated. Use `fun.max` instead.
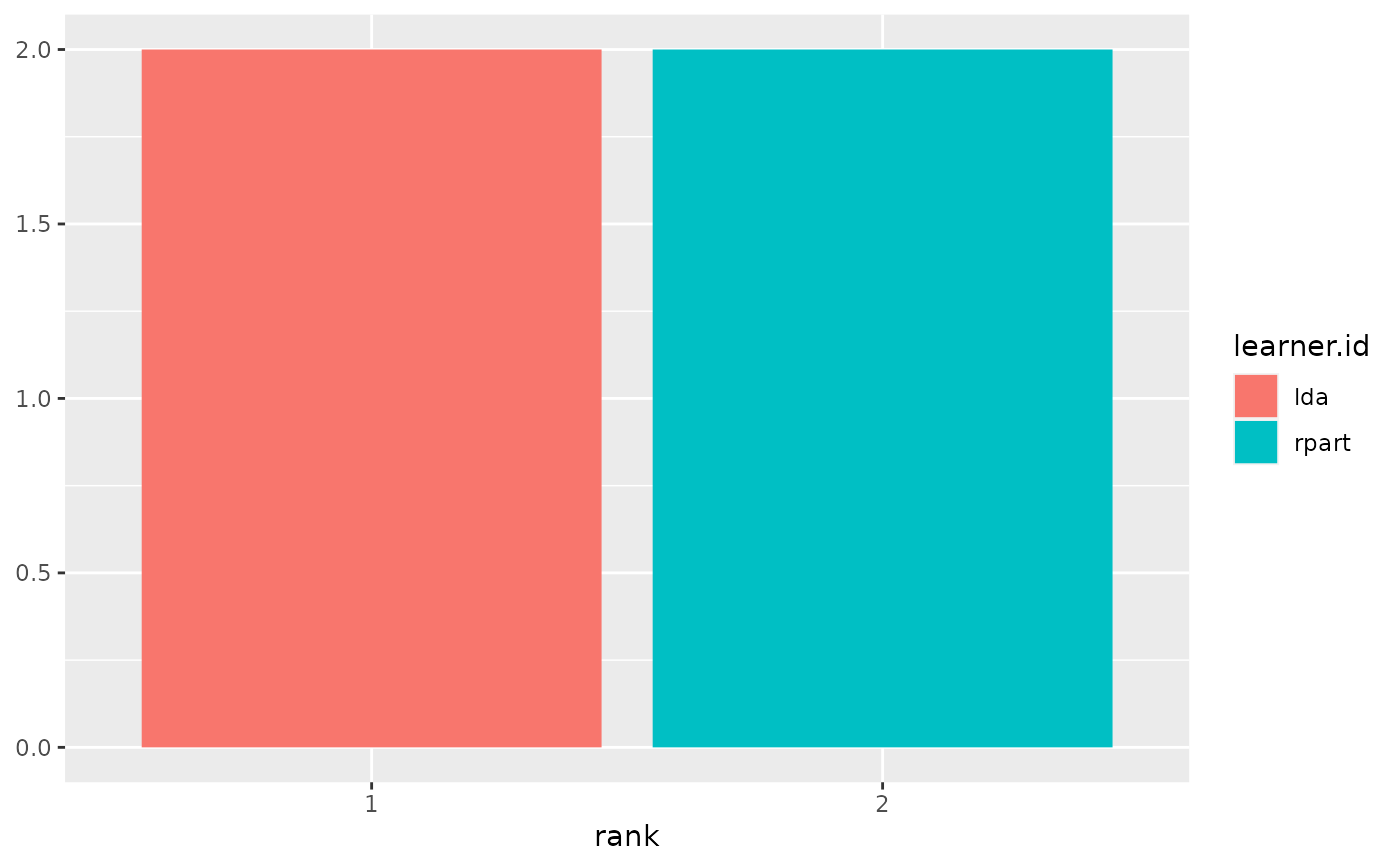
 plotBMRRanksAsBarChart(bmr, pos = "stack")
 friedmanTestBMR(bmr)
#>
#> Friedman rank sum test
#>
#> data: acc.test.mean and learner.id and task.id
#> Friedman chi-squared = 2, df = 1, p-value = 0.1573
#>
friedmanPostHocTestBMR(bmr, p.value = 0.05)
#> Loading required package: PMCMRplus
#> Warning: Cannot reject null hypothesis of overall Friedman test,
#> returning overall Friedman test.
#>
#> Friedman rank sum test
#>
#> data: acc.test.mean and learner.id and task.id
#> Friedman chi-squared = 2, df = 1, p-value = 0.1573
#>
friedmanTestBMR(bmr)
#>
#> Friedman rank sum test
#>
#> data: acc.test.mean and learner.id and task.id
#> Friedman chi-squared = 2, df = 1, p-value = 0.1573
#>
friedmanPostHocTestBMR(bmr, p.value = 0.05)
#> Loading required package: PMCMRplus
#> Warning: Cannot reject null hypothesis of overall Friedman test,
#> returning overall Friedman test.
#>
#> Friedman rank sum test
#>
#> data: acc.test.mean and learner.id and task.id
#> Friedman chi-squared = 2, df = 1, p-value = 0.1573
#>